The most expensive mistake on a production line is not made during installation. It is made earlier, on paper, when a design starts from assumptions instead of measurements. Data-driven production line design flips that order. It puts real floor data before the drawing, not after.
For a plant manager or a procurement lead, this matters in plain terms. A line that looks correct in a layout can still stall the first week it runs. The gap between a clean drawing and a working line is almost always filled with things nobody measured. This article explains why that gap forms, what it costs, and how measuring the floor first closes it.
We will keep the engineering at a general level. The goal is not to sell a machine. It is to show how a disciplined approach to data changes the outcome of a line, from the first survey to the day it runs at full speed.
2. Where the Problem Starts
Most line designs begin with two shortcuts. The first is the catalog figure: a belt speed or a capacity number taken from a datasheet. The second is the phrase every engineer has heard, "this is how it usually runs."
Both shortcuts are reasonable, but both are incomplete. A datasheet describes a product in ideal conditions. It does not describe your product, on your floor, at your line speed, during your format change.
Real product behaves differently in every plant. A sealed tub, a glass bottle, and a tray of fresh food each move, slide, and settle in their own way. The same product can even behave differently between two lines in the same factory, because the surfaces, the speeds, and the transfer points are not identical. A design that ignores this starts with a hidden error already built in.
3. What It Costs on the Floor
When a line is drawn from assumptions, the damage rarely shows up as one dramatic failure. It arrives as a series of daily problems that are hard to trace back to their source.
The first cost is stalling: a section that looked fine on paper turns out to be a bottleneck in production. Product piles up at that point, pressure builds backward, and the machine upstream has to slow or stop. One unmeasured spot sets the pace for the entire line.
The second cost is rework, and it surfaces when the flaw appears during startup, on site, with the line half-built. Conveyors get shortened, transfers get rebuilt, and controls get re-tuned, and every one of those changes costs time the project did not plan for. What a survey would have caught in a day becomes weeks of correction during commissioning.
The third cost is trust, because a line that fights itself in its first month makes the operations team wary of it. Operators start working around it instead of with it. That hesitation is hard to measure, though any plant manager who has lived through a rough startup knows it well.
4. The Engineering Behind Real Flow
To understand why measurement matters, it helps to see what a catalog cannot tell you. Four things in particular only reveal themselves on the floor.
The first is real speed under load, because a line rarely runs at its nominal figure for long. It surges and it pauses, and the true flow is the pattern of those bursts, not the average printed on a datasheet.
The second is where the bottleneck forms, since every line has one point that limits the rest. On paper all sections look balanced, but in production one transfer, one curve, or one narrow section quietly caps the whole flow. That point is only visible when the real product moves through it.
The third is format change behavior, and most lines run more than one product or package. The moment of changeover, when the line switches from one format to another, is where many designs break. A layout that handles one product cleanly can jam when the next format arrives, because its shape, weight, or spacing is different.
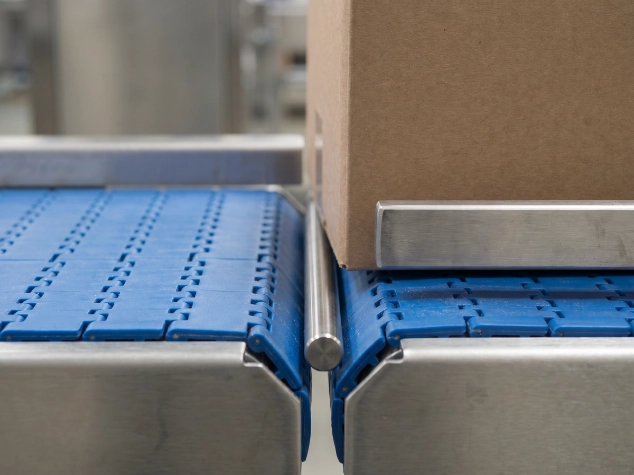
The fourth is the transfer point, and product does not fail in the middle of a straight conveyor. It fails where one conveyor hands off to the next, where geometry, friction, and timing all meet. These handoffs are specific to each line, and they are exactly what assumptions gloss over.
For the business, the translation is simple. These four unknowns are where budget and schedule leak. Measuring them first turns them from surprises into design inputs.
5. What Measuring First Actually Looks Like
Data-driven design is not a single step. It is a short discipline applied before the drawing is finished.
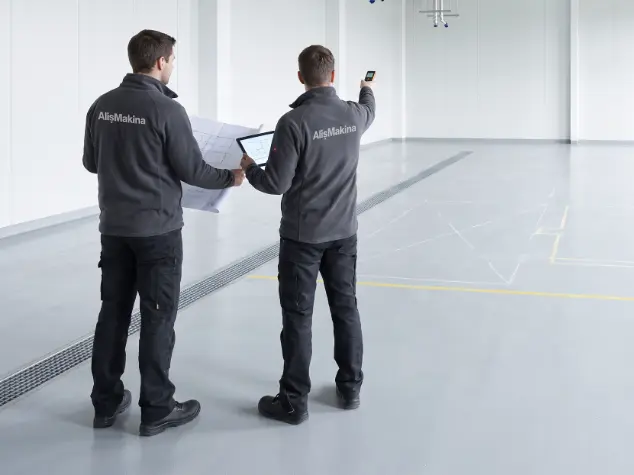
It starts with a site survey. The engineering team goes to the floor and records how the real product moves: its true speed, the points where it slows, and the spots where it crowds. Nothing here relies on memory or catalog values.
Next comes bottleneck mapping. With the flow recorded, the limiting points become visible. The team can see which transfer or which section will cap the line before a single part is ordered.
Then the format changes get tested. If the line will run several products, each one is checked against the same layout. A design that only works for one format is a design that will stall the day the second product arrives.
Finally, the design is validated against the data. Weak points are stress-tested on the plan, not discovered during startup. Belt type, transfer geometry, and flow function are chosen to match what was measured, not what was assumed. The result is a layout whose risks were already found and fixed before the line was built.
6. Design Criteria That Come From Data
Once the floor is measured, the real design criteria come into focus. Each one is a decision that data should drive, not assumption.
Product type sets the handling logic: a rigid bottle, a soft package, and an open food product each need different surfaces and transfers.
Line speed defines the tempo, so it must hold at the true speed under load, including the surges, not just the nominal figure.
Space constraints shape the layout, and a survey shows the real room available: the columns, drains, and existing equipment a generic drawing ignores.
Hygiene requirements guide the structure: for open food contact, the layout must stay cleanable and accessible. That need shapes the frame long before the belt is chosen.
Integration boundaries set the edges, since the new line meets machines that already exist. Where it connects, how it aligns, and how the flow stays continuous across that boundary are all design decisions. All of them depend on measured reality.
7. The Aliş Makina System View
Here is the point that ties it together. A line problem is rarely solved by picking a better component. It is solved by treating the line as one system and designing it from measured behavior.
Geometry, surface choice, and flow function are not separate decisions. They work together, and they only work when they match the real product, not a catalog version of it. A belt chosen without knowing the real flow is a guess. A transfer designed without knowing the real speed is a risk.
Aliş Makina designs and integrates lines around this discipline. We measure first, validate the design against that data, and test the weak points before anything is installed. The efficiency of a line does not begin with the equipment. It begins with the decision to build the design on data instead of assumption.
8. FAQ
Why not just use catalog figures for line design?
Catalog figures describe a product in ideal conditions. They do not capture how your specific product moves on your floor, at your speed, during your format change. Using them alone builds a hidden error into the design from the start.
What is a site survey in this context?
A site survey is the step where the engineering team measures the real production floor: actual product speed, where the line slows, where product crowds, and how format changes behave. It turns assumptions into measured inputs before the design is finalized.
How does measuring first save money?
It moves problem-finding from startup to design. A flaw caught during a survey is corrected on paper in a day. The same flaw found during commissioning is fixed on site, under pressure, with the line half-built, and that costs far more time.
Does data-driven design slow the project down?
The survey adds time at the front. It removes far more time at the back, where unplanned rework during startup is the most expensive delay a project can carry. The net effect is usually a faster, calmer commissioning.
What happens at transfer points that makes them so important?
Product usually fails where one conveyor hands off to the next, not in the middle of a straight run. Geometry, friction, and timing all meet at the transfer. Because these handoffs are specific to each line, they are exactly where assumptions cause trouble.
9. Conclusion
A production line is a system, and a system is only as sound as the data it was designed on. Catalog values and habit can produce a drawing that looks complete. Only measured floor data can produce a line that runs.
Data-driven production line design is not a luxury step. It is the difference between a layout that works on paper and a line that holds its pace in production. Measuring the real flow first, mapping the bottlenecks, and testing the weak points before installation is what keeps a line stable over the long run.
The order is the whole point. Data first, design second. A line built that way starts from reality, and it keeps running because reality is where it began.